Received: February 2020
DOI 10.17677/fn20714807.2020.01.02
Fluorine Notes, 2020, 128, 3-4
ALGORITHMS FOR FRAGMENTATION OF n-ALKANES AND n-PERFLUOROALKANES
N.D. Kagramanov
A. N. Nesmeyanov Institute of Organoelement Compounds, Russian Academy of Sciences, 119991, GSP-1, Moscow, B-334, Vavilov St. 28
e-mail: ndkagram@gmail.com
Abstract: The fragmentation algorithm [M]+.n-alkanes C1-C60 and n-perfluoroalkanes C1-C20 was established by analysis of spectra
from NIST libraries. The alkyl ions of [CnH2n + 1]+ n-alkanes
were obtained as a result of two series that arise during primary separations from [M]+.methyl
and ethyl radicals that open up a methylene chain, and subsequent emissions of neutral ethylene molecules.
This fragmentation algorithm is confirmed by examples of mass spectra emulation of deuteroalkanes.
A series of olefinic [CnH2n]+ and alkenyl [CnH2n-1]+ n-alkane ions are formed from [M-H]+ and [M -2H]+ at detachment of
methyl and ethyl radicals and subsequent emissions of ethylene molecules.
In spectra of n-perfluoroalkanes,
a series of perfluoroalkyl ions [CnF2n +1]+ occurs as a result of
initial detachment of fluorine atom and subsequent emissions of difluorocarbene. The less intense
series of perfluoroalkenyl ions [CnF2n-2]+ peaks are the result
of three successive detachments of fluorine atom M-57 and subsequent emissions of difluorocarbene:
M-107, M-157, M-207 ... The primary alkenyl fragmentation process of n-perfluoroalkanes
is different from primary process of alkyl fragmentation with two additional detachments of fluorine
atom, which require additional time.
By comparing the spectra of n-octane and n-perfluorooctane
recorded via the magnetic mass spectrometer and the ion trap mass spectrometer (Polaris Q), it was
confirmed that the ratio of peak intensities of competing alkyl and alkenyl fragmentation depends
on ion residence time in the separation zone.
Keywords: mass spectrometry, n-alkanes, n-perfluoroalkanes, n-deuteroalkanes, fragmentation algorithms, spectrum emulation, fragmentation competition.
Introduction
Over the past 50-60 years the mysterious and not decrypted algorithms of fragmentation due to ionisation of n-alkanes and n-perfluoroalkanes by electrons have moved from the terra incognita category to the similis est category (it’s not fashionable). To restore the lost status of this problem, a real literature review and analysis of mass spectra of n-alkanes and n-perfluoroalkanes presented in the NIST libraries were performed.
The mass spectra of n-alkanes were described, on the one hand, as a simplest mass spectra of heavy hydrocarbons [1], and on the other, as possibly the most complex hydrocarbons [2-3].
A theoretical analysis of molecular ions decay for normal hydrocarbons [4] postulated that the resulting fragment ions are a result of successive decay events in which each ion decays to produce an ion with the number of hydrocarbon atoms with at least half of the original number of atoms.
In a number of papers, the fragmentation of n-alkanes was studied using the technique of metastable peaks, notably along with primary separation of ·C2H5, ·C3H7 and ·C4H9 radicals; the emission of molecules: H2, CH4, C2H2, C2H4, C3H6 was also considered [5-7]. The base publication, which made it possible to determine the isotopic composition of formed ions and to be able to evaluate the results of emulation of deuteroalkanes spectra along one or another fragmentation path, was the paper [3]. However, none of n-alkane decay algorithms was recognized as adequate when conformance inspection between existing experimental isotopic distribution of formed ions in the spectra of labeled alkanes [3] and the distributions obtained as a result of proposed fragmentation paths [8-11,12,13].
On page 47 of review [14], summarizing the previous publications, their authors conclude: “It can be assumed with sufficient reliability that decay of normal paraffin hydrocarbon molecules during electron impact is characterized by an initial non-selective detachment of C-C bonds with subsequent stagewise decomposition of initially formed products”. Based on this conclusion, presented in Fig. 1, the mass spectra of n-alkane C60 and n-perfluoroalkane C20, illustrating methylene and difluoromethylene “glide paths”, are “mirages” that hide a complex real mechanism of decay.
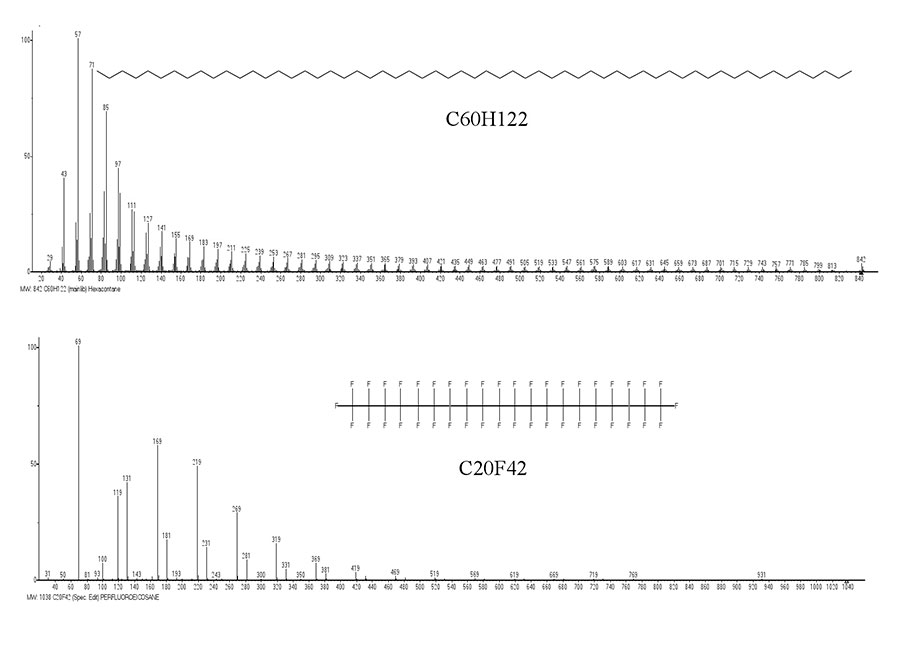
Figure 1. Mass spectra of n-C60H122 and n-C20F42 (from NIST libraries).
However, such harmonious, regular, smoothly increasing spectra permits to suppose that it are based on a simple and universal fragmentation algorithm. Given the “methylene” nature of alkanes and perfluoroalkanes fragmentation, the first question has always been the possibility of methylene (as well as difluorocarbene) separation from ions formed after chain opening, when the H, F atoms, methyl or trifluoromethyl radicals are detached from the molecular cation radicals.
In monograph [15], the author concludes: «There are very weak peaks of metastable ions in mass spectra of alkanes, which correspond to process of CH2 formation. However, the contribution of such processes to fragmentation is negligible, given the high enthalpy of formation of EO CH2 equal 90 kcal/mol. The detachment of CH2 is observed only for very simple molecules with limited potential fragmentation.
100% CH2 = CH2+. +.CH2 1.8%
A much more intensive release of difluorocarbene occurs, which is 43 kcal/mol more stable than methylene (Atlas, 1970; Budzikiewicz, 1979)».
On page 146 of review [14] the authors report: «In spectra of perfluoroparaffins, between two fairly intense peaks the peaks of metastable transitions are observed, which corresponds to detachment of the CF2 group».
The relative probability of fragmentation paths for alkanes and perfluoroalkanes: with the detachment of H and F atoms, CH2 and CF2 carbenes, alkyl and perfluoroalkyl radicals, must be estimated taking into account both the standard enthalpies of formation of detached fragments (see Table 1) [15,16], and the magnitude of their masses. When choosing a participant in fragmentation processes from applicants with admissible education enthalpies, a priority remains for a fragment with a minimum mass value.
Table 1. Enthalpy of formation ΔHf0 [15*, 16P].
|
Enthalpy of formation ΔHf0 (g), 298K (kkal/mol) |
|
|
H 52,1* |
F 19,0* |
|
СH2 90* |
CF2 -43,2* |
|
·CH3 34,8* |
·CF3 -115* |
|
·C2H5 26,5* |
·C2F5 -217* |
|
C2H4 12,5 (ref.) |
C2F4 -152P |
|
C3H6 4,88 (ref.) |
C3F6 -259P |
|
n-·C3H7 21,0* |
n-·C3F7 -313* |
|
n-·C4H9 15,4* |
|
|
СH4 - 17,89 (ref.) |
CF4 -218P |
A most energy-consumption way of alkanes and perfluoroalkanes fragmentation (except for CH2 detachment) (see Table 1.) is the emission of H and F atoms with minimal masses, with detachment of which fragmentation of both lower and higher homologs begins.
The detachment of ·H (52.1 kcal/mol), methyl .CH3 (34.8 kcal/mol) and ethyl radicals .C2H5 (26.5 kcal/mol) are three main primary processes of decay the M·+ homologs of C4-C60 n-alkanes, which open up the methylene chain, which is further fragmented by successive detachments of ethylene molecules (12.5 kcal/mol). The presented n-alkane fragmentation algorithm was successfully confirmed by emulation of spectra of deuterosubstituted analogues [3].
In spectra of perfluoroalkanes, in addition to process of atom detachment of·F atoms (19 kcal/mol), the second really occurring process should be considered (for all possible participants in fragmentation CF2 (-43.2), ·CF3 (-115), C2F4 (-152) , ·C2F5 (-217)) only as sequential detachment of difluorocarbene with minimum weight. This perfluoroalkane fragmentation algorithm is described in detail in corresponding section of this publication.
Despite the energy utility, the synchronous detachments of neutral CH4 and CF4 molecules are unlikely in comparison with actually occurring sequential detachments of ·H and ·CH3, as well as the detachments of 2·F and CF2.
Fragmentation of n-alkanes
The fragmentation of n-alkanes, as well as of alkyl halides, depends on molecular weight [17]. As the mass of homologues of n-alkanes increase, the vibrational excitation M·+ decreases. The peaks of basic ions: m/z 16-C1, 28-C2, 29-C3, 43- (C4-C5),! 57-C6 ,! 43 (C7-C10), 57 (C11-C60) change, and the growth of weak peaks of alkyl ions [CnH2n + 1]+, the intensities of which in C60 spectrum increase to 87%+ [C5H11] m/z 71, 69%+ [C6H13 ] 85 and 34%+ [С7H15] 99 (Fig. 2).
The intensity of most intensive peak of alkenyl [CnH2n-1]+ of ion +[C3H5] m/z 41, equal to 70% in spectrum of C6, decreases to 20% in C21 and to 11% in C60, and the intensities of weak alkenyl peaks increase in spectrum of C60 to 44 % +[С7H13] m/z 97 and to 27% +[С8H15] m/z 111 (Fig. 2). The peak of +[C7H13] (m/z 97) becomes the most intense peak of alkenyl fragmentation [CnH2n-1], and ion +[C3H5] becomes its fragment ion.
In compared with increase in peak intensities of alkyl and alkenyl ions occurring with an increase in molecular weight of homologs, the peak increase of olefin ions [CnH2n]+ is minimal. Perhaps this is due to the fact that olefin ions are an “intermediate link” between alkyl and more stable alkenyl ions.
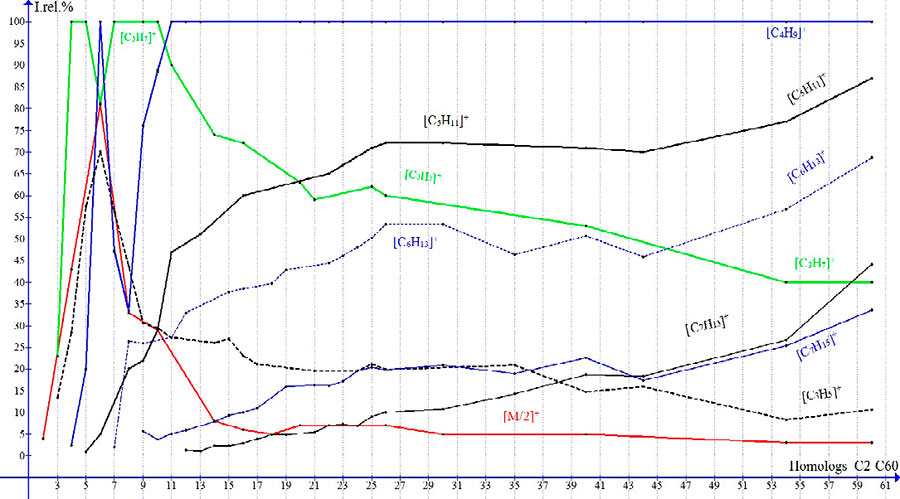
Figure 2. Dependences of Irel (in %) on its molecular weight for ion peaks of n-alkanes homologues.
In contrast to spectra of C1-C8, in which there are two zones: the zone of increase in peak intensities and the zone of its decline; the spectra of C12-C60 have the plateau, after which there is a sharp increase in intensity of fragment peaks. With increase in molecular weight of homologs, the plateau of spectrum increases. If this plateau in spectrum includes a large number of weak peaks (the intensities of which gradually increase as their mass decreases), then the sharp fragmentation section will contain no more than 4 peaks with a sharply increasing intensity. A sharp increase in intensity of alkyl peaks begins when the ratio of formed ions masses to the mass of detached ethylene will reach 71: 28 = 2,5: 1 and 85: 28 = 3,0: 1, respectively.
In spectra of C9-C60, the almost unchanged position of transition the plateau zone to the sharp fragmentation zone corresponds to ions +[C7H15] m/z 99 and +[C8H17] m/z 113, whose masses are approximately twice as large the masses of basic ions m/z 43 and m/z 57.
First two homologues of n-alkanes C1 and C2 are fragmented with alternating formation of corresponding cations and radical cations by successive detachment of four and six hydrogen atoms, respectively. The detachment of hydrogen atoms from [M]·+ is a primary process of fragmentation of all n-alkanes homologues. The base ion [C2H4]+ in ethane spectrum is formed by detachment of two hydrogen atoms, while decomposition of C2 (M/2) leads to +[CH3] ion whose peak intensity does not exceed 4.4%. C3 is fragmented by successive detachment of eight hydrogen atoms. Its base ion +[C2H5] is the result of methyl radical release. The mass ratio +[C2H5] and .CH3 during decay of C3 29: 15 = 1.93: 1 allows us to conclude that, in comparison with CH3, base ion receives almost twice as large of energy. The detachment of methyl radical is clearly visible in C2-C7 spectra, in which the molecular mass is minimal, and excitation energy (in comparison with C8-C60 homologs) is maximum. With rising in its molecular weight and decreasing in vibrational excitation of M+, the detachment of methyl radical as before is more energy-consumption (by about 8 kcal/mol) compared to detachment for ethyl radical, but its peak intensity decreases.
In spectra of C8-C60, the primary detachment of ethyl radical is visible, but the detachment of methyl radical no matter somewhat happens. However, this is not so, the primary detachment of methyl radical occurs in all homologues, except C1, only M-CH3 peak in C8-C60 spectra acquires a trace intensity. In spectra of C18, C22, C25, C26 and C35 (NIST Library), the peaks +[M-CH3] are clearly visible.
The detachments of methyl and ethyl radicals are two main primary processes of alkyl fragmentation of n-alkanes. Further fragmentation is a sequential detachment of neutral ethylene molecules, with formation of methyl and ethyl series of ions. The first ethylene release appears to occur during fragmentation of C4 homolog. In C4, the detachment of methyl radical leads to base ion +[C3H7], and the detachment of ethyl radical (decomposition M/2) to ion +[C2H5] equal to 43%. The peak +[CH3] equal to 6% in spectrum of C4 arises either as a result of detachment from M·+ radical ·C3H7 (m/z 43, enthalpy 21.0 kcal/mol), or by detachment of ethylene molecule (m/z 28, enthalpy 12,5 kcal/mol) from the base ion +[C3H7]. The release of ethylene with a mass of 28 is more likely, since it requires less energy compared to the detachment of ·C3H7 (with mass of 43).
The comparison of alkyl peaks in mass spectrum of n-octane with the mass numbers of its spectrum emulated by algorithm of parallel primary detachments of ·CH3 and ·C2H5, with subsequent sequential emissions of ethylene (see Table 2) confirms its complete coincidence.
Table 2. The alkyl [CnH2n + 1] ions in mass spectrum of n-octane C8H18.
CH3-CH2-CH2-CH2-CH2-CH2-CH2-CH3 [NIST Library]
|
15 1% |
29 27% |
43 100% |
57 М/2 33% |
71 20% |
85 26% |
99 0,1% |
114 6% М |
The mass numbers for spectrum of n-octane emulated at primary ·CH3 detachment
|
15- |
-28 |
-28 |
-28 |
-15 |
Mass |
|
CH3- |
-H2C-H2C- |
-H2C-CH2- |
-H2C-CH2- |
. CH3 |
114 |
|
15 |
43 |
71 |
99 |
m/z |
The mass numbers for spectrum of n-octane emulated at primary ·C2H5 detachment
|
29- |
-28 |
-28 |
-29 |
Mass |
|
CH3-CH2- |
-H2C-H2C- |
-CH2-CH2- |
. CH2-CH3 |
114 |
|
29 |
57 |
85 |
m/z |
The mass numbers for spectrum of n-octane emulated at primary CH3 and ·C2H5 detachment
|
15 |
29 |
43 |
57 |
71 |
85 |
99 |
114 |
In spectra of n-alkanes homologues with an even number of carbon atoms, there is M/2 ion, when both the detached radical and the observed formed ion have the same mass. The presented fragmentation algorithm leads to formation of alkyl ions, including M/2 ion. However, in homologues C6 and C8 direct decomposition of M/2 is also possible (with detachment of radicals larger than ethyl (Fig. 2). In spectra of C4, C6 and C8, the peak intensities +[M/2] are 43%, 81%, and 33%, respectively.
With further increase in molecular mass of a homologue, with increase in masses of formed ion and radical, the M/2 peak moves from the zone of increase in spectrum intensities to the plateau zone with minimal intensities. The maximum intensity of 81%, close to the intensity for base ion, peak M/2 has only in spectrum of C6. Since the excess energy M+· is divided between the ion and the radical in half, the peak of M/2 ion cannot become the base one. For this reason, it is precisely in C6 spectrum that a certain “dumping” of base ion +[C3H7]” 43: 43 = 1: 1 occurs (Fig. 2). Instead of ion +[C3H7], the base ion in C6 temporarily becomes the ion [C4H9]+ 57: 29 = 1.96: 1, which is formed upon detachment of ethyl radical, which has a mass less than the mass of ion. In C6, the formation of M/2 ion 81% is accompanied by its strong hydrogen fragmentation with detachment of H atom and formation of olefin ion with m/z 42 41%, as well as the emission of second hydrogen atoms with formation of allylic ion [C3H5]+ 70% (Fig. 2 )
In C8 spectra, the intensity of M/2 ion with m/z 57 decreases to 33% and remains the same until C14, and [C3H7]+ ion, which is not formed by radical detachment ·С5H11 m/z 71 43 : 71 = 1: 1,65, but by release of methyl radical and two ethylene molecules. The final ethylene detachment leads to formation of base ion 43: 28 = 1.54: 1.
Sequential detachment of ethylene molecules is a more economical and more efficient process than detachment of the corresponding alkyl radicals with increasing masses. In case of ethylene emissions, the excitation energy is divided between the ion with a decreasing mass and ethylene with a constant mass that is more favorable for ion being formed than if it was divided between radical with an increasing mass and ion with a decreasing mass. The ion arising from detachment of ethylene receives a large fraction of energy until the mass of this ion becomes equal to mass of ethylene or less than mass of ethylene.
The basic ion intensity is achieved when mass ratio of basic ions and ethylene is 43: 28 = 1,53: 1 and 57: 28 = 2,04: 1. The subsequent detachments of ethylene lead to a change in mass ratio of ion: ethylene 15: 28 = 0,54 and 29: 28 = 1,04 in favor of mass of ethylene, the intensities of peaks +[CH3] and +[C2H5] are reduced.
Upon fragmentation of n-alkanes, together with alkyl series of ions the olefinic +[CnH2n] and akenyl +[CnH2n-1] series are formed. Unlike the alkyl series, these series arise through primary emissions of one and, accordingly, two hydrogen atoms, secondary detachments of methyl and ethyl radicals and subsequent emissions of ethylene molecules.
Since the detachment of hydrogen atoms is the most energy-consuming process, there is reason to believe that alkenyl ions do not arise by hydrogen fragmentation of each alkyl ion, with the exception of [M]·+ and possibly [M/2]+ homologs of C4-C8. The primary processes of alkyl and alkenyl fragmentation of n-alkanes are distinguished by two additional detachments of hydrogen atom, requiring additional time.
A comparison of n-octane spectra recorded by magnetic mass spectrometer and ion trap mass spectrometer (Polaris Q) (see Fig. 3) confirms that the ratio of peak intensities for alkyl and alkenyl series depends on the residence time for ions in the separation zone.
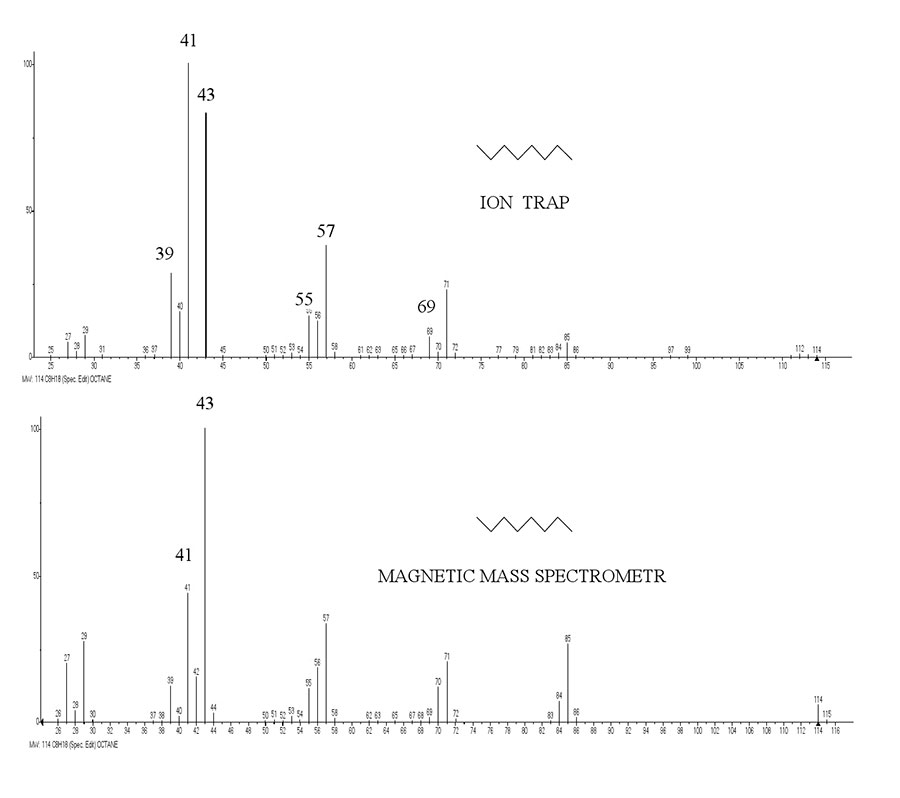
Figure 3. Spectra of n-octane recorded by magnetic mass spectrometer and by ion trap mass spectrometer.
If in spectra recorded by magnetic mass spectrometer, the alkyl fragmentation is predominant, then in ion trap mass spectrometer, with an increase in residence time of [M]·+ in the separation zone, an increase in alkenyl fragmentation occurs and the basic ion becomes an alkenyl ion with m/z 41.
Mass spectra emulation of n-deuteroalkanes [3]
In accordance with proposed fragmentation algorithm, the mass numbers of emulated spectra of n-deuteroalkanes [3] were obtained by summing two series of alkyl ions formed during primary detachments of methyl and ethyl radicals and subsequent emissions of neutral ethylene molecules. The mass numbers of deuteroalkanes were emulated without taking into account the scrambling of adjacent methylene and deuteromethylene groups of a chain, however, the probability of these processes is discussed for each of compounds under consideration.
1. Mass numbers for mass spectrum of undecane D18C11H6 D18 (see [3], p. 2183, table III).
CD3-CD2-CD2-CD2-CH2- /CH2- /CH2-CD2-CD2-CD2-CD3
80← 94←
|
34 |
50 |
66 |
81* |
80 |
95* |
94 |
108 |
124 |
140 |
174 |
The mass numbers for mass spectrum of n-undecane D20 emulated at primary ·CD3 detachment
|
34 |
-32 |
-28 |
-30 |
-32 |
-18 |
Mass |
|
D3C-D2C- |
-D2C-D2C- |
-H2C-H2C- |
-H2C-CD2- |
-CD2-CD2- |
·CD3 |
174 |
|
D5=34 |
D9=66 |
D9=94 |
D11=124 |
D15=156 |
The mass numbers for mass spectrum of n-undecane D18 emulated at primary ·C2D5 detachment
|
18 |
-32 |
-30 |
-28 |
-32 |
-34 |
Mass |
|
D3C- |
-D2C-D2C- |
-D2C-H2C |
-H2C-H2C- |
-CD2-CD2- |
CD2-CD3 |
174 |
|
D3=18 |
D7=50 |
D9=80 |
D9=108 |
D13=140 |
The mass numbers for mass spectrum of n-undecane D18 emulated at ·CD3 and ·C2D5 detachments
|
18 |
34 |
50 |
66 |
80 |
94 |
108 |
124 |
140 |
156* |
174 |
The mass numbers for mass spectrum of n-undecane D18 emulated at ·CD3 and ·C2D5 detachments coincide with mass numbers of its spectrum, with exception of ions with m/z 95* and 81*.
At relative peak intensity with m/z 94 I = 323 (see [3], p. 2183, Table III) the ion intensity with m/z 95 * equal to 21,9, that coincides with intensity of 21,11 of its isotopic ion C13. At relative peak intensity with m/z 80 I = 206 (see Table III), the intensity of its isotopic ion C13 with m/z 81 is 11.19, which is close to intensity of 19.1 (see [3], p. 2183, Table III). When CH2-/CH2 bonds of n-undecane D18 are broken with formation of С6H4D9 ions with m/z 94 and С5H2D9 with m/z 80, the absence in adjacent bonds the detachable ethylene molecules of СD2 groups excludes the scrambling. The ion intensities with m/z 95 and 81 in spectrum of n-undecane D18 (see [3], Table III) correspond to the intensities of corresponding isotopic peaks of C13 ions with m/z 94 and 80. The ion peak with m/z 156 *, M-CD3, is absent in mass spectrum D18 [3] has too low intensity.
2. Mass numbers for mass spectrum of undecane D20C11H4 D20 (see [3], p. 2183, Table III)
CD3-CD2-CD2-CD2-CH2-/CD2-/CH2-CD2-CD2-CD2-CD3
80← 96←
|
34 |
50 |
66 |
82-81* |
80 |
97* |
96 |
110 |
126 |
142 |
176 |
The mass numbers for mass spectrum of n-undecane D20 emulated at primary ·CD3 detachment
|
34 |
-32 |
-30 |
-30 |
-32 |
-18 |
Масса |
|
D3C-D2C- |
-D2C-D2C- |
-H2C-D2C- |
-H2C-CD2- |
-CD2-CD2- |
-CD3 |
176 |
|
D5=34 |
D9=66 |
D11=96 |
D13=126 |
D17=158 |
The mass numbers for mass spectrum of n-undecane D20 emulated at primary ·C2D5 detachment
|
18 |
-32 |
-30 |
-30 |
-32 |
-34 |
Масса |
|
D3C- |
-D2C-D2C- |
-D2C-H2C |
-D2C-H2C- |
-CD2-CD2- |
-CD2-CD3 |
176 |
|
D3=18 |
D7=50 |
D9=80 |
D11=110 |
D15= 142 |
The mass numbers for mass spectrum of n-undecane D20 emulated at ·CD3 и ·C2D5 detachments
|
18 |
34 |
50 |
66 |
80 |
96 |
110 |
126 |
142 |
158 |
176 |
The mass numbers for mass spectrum of n-undecane D20 emulated at ·CD3 and ·C2D5 detachments coincide with mass numbers of its spectrum, with exception of ions with m/z 97*, 81* and 82*. When the ion with m/z 96 is formed, the absence of CD2 group in adjacent bond excludes scrambling of CD2-/CH2 bond and cannot lead to ion formation with m/z 97*.
At relative peak intensity with m/z 96 I = 323 (see [3], p. 2183, Table III), the intensity of ion with m/z 97*, equal to 29.6, corresponds to intensity of isotopic ion 96 C13 21,04. The ions with m/z 81* and 82* are formed as a result of partial scrambling of nodal broken bond CH2-/CD2. The ion peak with m/z 158, M-CD3, which is absent in D20 mass spectrum [3], has too low intensity.
3. Mass numbers for mass spectrum of n-undecane D22C11H2 D22 (see [3], p. 2183, Table III)
CD3-CD2 -CD2-CD2-CD2-/CH2-/CD2-CD2-CD2-CD2-CD3
82← 96←
|
34 |
50 |
66 |
81* |
82 |
98*, 97* |
96 |
112 |
128 |
144 |
178 |
The mass numbers for mass spectrum of n-undecane D22 emulated at primary ·CD3 detachment
|
34 |
-32 |
-30 |
-32 |
-32 |
-18 |
Mass |
|
D3C-D2C- |
-D2C-D2C- |
-D2C-CH2- |
-CD2-CD2- |
-CD2-CD2- |
·CD3 |
178 |
|
D5=34 |
D9=66 |
D11=96 |
D15=128 |
D19=160* |
The mass numbers for mass spectrum of n-undecane D22 emulated at primary ·C2D5 detachment
|
18 |
-32 |
-32 |
-30 |
-32 |
-34 |
Mass |
|
D3C- |
-D2C-CD2- |
-D2C-CD2- |
-H2C-D2C- |
-CD2-CD2- |
·CD2-CD3 |
178 |
|
D3=18 |
D7=50 |
D11=82 |
D13=112 |
D17=144 |
The mass numbers for mass spectrum of n-undecane D22 emulated at ·CD3 и ·C2D5 detachments
|
18 |
34 |
50 |
66 |
82 |
96 |
112 |
128 |
144 |
160* |
178 |
The mass numbers for mass spectrum of n-undecane D22, emulated upon ·CD3 and ·C2D5 radicals detachment, coincide with mass numbers of its spectrum, with exception of ions with m/z 97*, 98* and 81*, formed by partial scrambling of nodal bonds CH2 -/CD2 and CD2-/CH2. In spectrum of n-undecane D22 (see [3], p. 2183, Table III), along with intense peak C6H2D11 m/z 96 (D11) there are peaks with medium intensity C6HD12 with m/z 97* (D12) and C6D13 with m/z 98* (D13), which allows us to conclude that in parallel with bond breaking CH2-CD2, it transforms into CDH-CHD and CD2-CH2; the breaking of this bonds lead to ions formation with m/z 97 and 98.
Together with breaking of nodal bond СD2-CH2 and ion formation С5D11 with m/z 82, in parallel there is a mutual exchange of one atom D to H, and atom H to D. That is, the nodal bond not only breaks but also transforms into CDH-CHD bond, the breaking of which leads to formation of С5HD10 ion with m/z 81. The ion peak with m/z 160* M-CD3, which is absent in D22 mass spectrum [3], has too low intensity.
4. Mass numbers for mass spectrum of n-dodecane D22C12H4 D22 (see [3], p. 2184, table IV)
CD3-CD2-CD2-CD2-CD2-/CH2 - /CH2 - /CD2-CD2-CD2-CD2-CD3
82← 96← 110←
|
34 |
50 |
66 |
82 |
97*? |
96 M/2 |
112*,111* |
110 |
126 |
142 |
158 |
M 192 |
The mass numbers for mass spectrum of n-dodecane D22 emulated at primary ·CD3 detachment
|
18 |
-32 |
-32 |
-28 |
-32 |
-32 |
-18 |
M |
|
CD3- |
-CD2-CD2- |
-CD2-CD2- |
-H2C-CH2- |
-CD2-CD2- |
-CD2-CD2- |
·CD3 |
192 |
|
D3=18 |
D7=50 |
D11=82 |
D11=110 |
D15=142 |
D19=174* |
The mass numbers for mass spectrum of n-dodecane D22 emulated at primary ·C2D5 detachment
|
34 |
-32 |
-30 |
-30 |
-32 |
-34 |
M |
|
CD3-CD2- |
-CD2-CD2- |
-D2C-CH2- |
-CH2-CD2- |
-CD2-CD2- |
·C2D5 |
192 |
|
D5=34 |
D9=66 |
D11=96 |
D13=126 |
D17=158 |
The mass numbers for mass spectrum of n-dodecane D22 emulated at primary ·CD3 and ·C2D5 detachments
|
34 |
50 |
66 |
82 |
96 |
110 |
126 |
142 |
158 |
174* |
192 |
The mass numbers for mass spectrum of n-dodecane D22 emulated at ·CD3 and ·C2D5 detachments coincide with mass numbers of its spectrum, with exception of ions with m/z 111*, 112*, which are formed upon scrambling of CH2-CD2 bond. The ion formation with m/z 97 due to remoteness of the nearest CD2 group is impossible. At relative intensity of peak 96 equal to 334 (see Table IV), the intensity of its isotopic ion C13 with m/z 97 should be 21,75, which, within the error, coincides with the intensity 28,0, presented in Table IV (see [3], p. 2184). The ion peak with m/z 174* M-CD3, which is absent in mass spectrum of n-dodecane D22 [3], has too low intensity.
5. Mass numbers for mass spectrum of n-dodecane D20C12H6 D20 (see [3], p. 2184, table IV).
CH3-CD2-CD2-CD2-CD2-CD2-/CD2-/CD2-CD2-CD2-CD2-CH3
95← 111←
|
34 |
50 |
66 |
82 |
98-97* |
96* |
95 |
111 |
127 |
143 |
159 |
M 190 |
The mass numbers for mass spectrum of n-dodecane D20 emulated at primary ·CH3 detachment
|
15 |
-32 |
-32 |
-32 |
-32 |
-32 |
-15 |
M |
|
CH3- |
-CD2-CD2- |
-CD2-СD2- |
-D2C-CD2- |
-CD2-CD2- |
-CD2-CD2- |
·CH3 |
190 |
|
D0=15 |
D4=47 |
D8=79 |
D12=111 |
D16=143 |
D20=175* |
The mass numbers for mass spectrum of n-dodecane D20 emulated at primary ·CD2CH3 detachment
|
-31 |
-32 |
-32 |
-32 |
-32 |
-31 |
M |
|
CH3-CD2- |
-CD2-CD2- |
-D2C-CD2- |
-CD2-CD2- |
-CD2-CD2- |
·CD2CH3 |
190 |
|
D2=31 ! |
D6=63 ! |
M/2 D10=95 |
D14=127 |
D18=159 |
The mass numbers for mass spectrum of n-dodecane D20 emulated at ·CH3 and ·CD2CH3 detachments
|
31! |
47! |
63! |
79! |
95 |
111 |
127 |
143 |
159 |
175* |
190 |
First half of the mass numbers for emulated spectrum of n-dodecan D20 with m/z159, 143, 127,111, including M/2 95, coincides with mass numbers of its spectrum (see [3], p. 2184, Table IV). The second half of C12H6D20 spectrum with m/z 82, 66, 50 and 34 does not coincide with mass numbers of emulated spectrum, but coincides with mass numbers of n-dodecane C12H4D22, which does not contain the terminal methyl groups. The decay of M/2 190/2 = 95 is consistent with gross formula of n-dodecane C12H6D20 and ion formation +[CH3 (CD2)5], but its further fragmentation oddly coincides with fragmentation of n-dodecane D22, the decay of which C12H4D22 M/2 leads to formation the ion 192/2 = 96 +[CD3 (CD2)4CH2] and the ion with m/z 82 + [CD3 (CD2)4]. The ion with m/z 82 +[CD3 (CD2)4] cannot be formed from +[CH3 (CD2)5] as a result of a single CH3 detachment, because it is insufficient one more D atom. Since during final fragmentation process D20/2 an easily detachable terminal methyl group is involved, it cannot be excluded that, along with usual M/2 decay, the parallel, rearrangement decay occurs with simultaneous release of CH3 terminal group and stabilizing addition of deuterium atom to arising ion D atom. In this case, the further fragmentation of D20/2 will coincide with D22 fragmentation.
At relative peak intensity 95 equal to 411 (see [3], p. 2184, Table IV), the intensity of its isotopic ion C13 with m/z 96 should be 26,81, which is even higher than the intensity value of 18,5, presented in Table IV. But the peaks intensities with m/z 97 and 98, equal to 32,2 and 68,5, respectively, can only be explained by formation of C6HD12 and C6D13 ions.
The mass spectrum of n-dodecane D20 with a deuteromethylene chain and two terminal methyl groups illustrates the artificial, conflict fragmentation, uncharacteristic of n-alkanes, due to difference in masses of terminal group CH3 and groups CD2.
6. Mass numbers for mass spectrum of n-octane -1-D C8H17D1 (see [3], p. 2184, table V).
DCH2-CH2-CH2-CH2/-/CH2-CH2-CH2-CH3
58 57
|
16 |
30 |
44 |
58 |
72 |
86 |
115 |
The mass numbers for mass spectrum of 1-D n-octane emulated at primary ·CD3 detachment
|
16- |
-28 |
-28 |
-28 |
-15 |
Mass |
|
DCH2- |
-H2C-H2C- |
-H2C-CH2- |
-CH2-CH2- |
·CH3 |
115 |
|
D1=16 |
D1=44 |
D1=72 |
D1=100 |
The mass numbers for mass spectrum of 1-D n-octane emulated at primary ·C2H5 detachment
|
-30 |
-28 |
-28 |
-29 |
Mass |
|
DCH2-CH2- |
-H2C-H2C- |
-CH2-CH2- |
·CH2-CH3 |
115 |
|
D1=30 |
D1=58 |
D1=86 |
The mass numbers for mass spectrum of 1-D n-octane emulated at ·CH3 and ·C2H5 detachments
|
16 |
30 |
44 |
58 |
72 |
86 |
100* |
115 |
The mass numbers for mass spectrum of 1-D n-octane emulated at ·CH3 and ·CH2CH3detachments coincide with mass numbers of its spectrum (see [3], p. 2184, Table V). The absence in Table V the peak with m/z 100* M-CH3 is result of its low intensity.
The mass numbers for mass spectrum of 1-D n-octane emulated at primary ·CH2D detachment
|
15- |
-28- |
-28- |
-28- |
-16 |
Mass |
|
H3C- |
-H2C-H2C |
-H2C-H2C- |
-CH2-CH2- |
·CH2D |
115 |
|
D0=15 |
D0=43 |
D0=71 |
D0=99 |
The mass numbers for mass spectrum of 1-D n-octane emulated at primary ·CH2CH2D detachment
|
15- |
29- |
-28- |
-28- |
-30 |
Mass |
|
H3C- |
H3C-H2C- |
-H2C-H2C- |
-CH2-CH2- |
·CH2-CH2D |
115 |
|
D0=15 |
D0=29 |
D0=57 |
D0=85 |
The mass numbers for mass spectrum of 1-D n-octane emulated at ·CH2D and ·CH2-CH2D detachments
|
15 |
29 |
43 |
57 |
71 |
85 |
99 |
115 |
The mass numbers for 1-D mass spectrum of n-octane emulated at ·DCH2 and ·DCH2CH2 do not coincide with mass numbers of its spectrum [3]. This mismatch of spectra allows us to conclude that in case of terminal groups asymmetry that differ by only 1 Da, no deuterium-containing radicals are released, and lighter radicals ·CH3 and ·CH2CH3 are detached. That is, the introduction of even one terminal D atom changes the fragmentation of n-octane.
7. Mass numbers for mass spectrum of n-octane -2-D1 C8H17D1 (see [3], p. 2184, table V)
CH3-CHD-CH2-CH2/-/CH2-CH2-CH2-CH3
58 57
|
16* |
30 |
44 |
58 |
72 |
86 |
115 |
The mass numbers for mass spectrum of 2-D1 n-octane emulated at primary ·CD3 detachment
|
15- |
-29 |
-28 |
-28 |
-15 |
Mass |
|
CH3- |
-DHC-H2C- |
-H2C-CH2- |
-CH2-CH2- |
·CH3 |
115 |
|
D0=15 |
D1=44 |
D1=72 |
D1=100 |
The mass numbers for mass spectrum of 2-D1 n-octane emulated at primary·CH2CH3 detachment
|
-30 |
-28 |
-28 |
-29 |
Mass |
|
CH3-CHD- |
-H2C-H2C- |
-CH2-CH2- |
·CH2-CH3 |
115 |
|
D1=30 |
D1=58 |
D1=86 |
The mass numbers for mass spectrum of 2-D1 n-octane emulated at ·CH3 and ·CH2-CH3 detachments
|
15 |
30 |
44 |
58 |
72 |
86 |
100* |
115 |
The mass numbers for mass spectrum of 2-D1 n-octane emulated at ·CH3 and ·CH2CH3 detachments coincide with the mass numbers of its spectrum (see [3], p. 2184, Table V), with exception of rearrangement ion with m/z 16 +[CH2D]. The presence of n-octane in spectrum of 2-D1 (see [3], p. 2184, Table V) instead of ion +[CH3] with m/z 15 - the CH2D with m/z 16 ion indicates that the breaking of terminal bond of CH3-CDH is accompanied by its 100% scrambling and transformation into CH2D-CH2 and instead of ion +[CH3] - the ion +[CH2D].
In contrast to terminal bond breaking, the bond breaking of CH3CHD-CH2 occurs with formation of ion with m/z 30. The absence of peak with m/z 100*, M-CH3 in Table V is due to its low intensity.
The mass numbers for mass spectrum of 2-D1 n-octane emulated at primary ·CH2D detachment
|
15- |
-28- |
-28- |
-29- |
-15 |
Mass |
|
H3C- |
-H2C-H2C |
-H2C-H2C- |
-CH2-CHD- |
·CH3 |
115 |
|
D0=15 |
D0=43 |
D0=71 |
D0=100 |
The mass numbers for mass spectrum of 2-D1 n-octane emulated at primary ·CH2CH2D detachment
|
15- |
29- |
-28- |
-28- |
-30 |
Mass |
|
H3C- |
H3C-H2C- |
-H2C-H2C- |
-CH2-CH2- |
·CHD-CH3 |
115 |
|
D0=29 |
D0=29 |
D0=57 |
D0=85 |
The mass numbers for mass spectrum of 2-D1 n-octane emulated at ·CH2D and ·CH2-CH2D detachments
|
15 |
29 |
43 |
57 |
71 |
85 |
99 |
115 |
The mass numbers for spectrum of 2-D1 n-octane emulated at CH2D and CH2-CH2D detachments do not coincide with mass numbers of spectrum (see [3], p. 2184, Table V). The detachment of methyl radical from adjacent group containing deuterium CH3-CHD- in position 2 does not occur. The presence of n-octane deuterium atom in position 2 disrupts the uniformity of methylene chain, so the fragmentation begins with opposite end of molecule that does not contain a deuterium atom.
When studying the deuterated undecane, dodecane, and octane-1-d [3], it was assumed that introduction of deuterium atoms into n-alkane molecules without disturbing or changing them, its fragmentation will help to understand and establish the occurring decay processes. An analysis of spectra presented in [3] showed that the fragmentation of symmetric deuterated paraffins - n-undecane D18, D20 and D22, as well as n-dodecane D22, which do not contain the terminal methyl groups, occurred the same way as in case of unsubstituted n-alkanes. The mass spectra of 1-D1 n-octane [3] and 2-D1 n-octane [3] containing only one D atom in one of terminal groups CH3 or C2H5 confirm that mass asymmetry of terminal groups, differing by only 1 Da, modifies n-octane fragmentation. The primary release of deuterium-containing radicals does not occur, but the lighter radicals ·CH3 and ·CH2CH3 are detached. The proximity of formation enthalpies for ·CH3 34.1 [18] and ·CD3 32.5 + -1 [19] allows us to conclude that the order of radical separation is determined by its mass.
The mass spectrum for n-dodecane D20 [3] with deuteromethylene chain and two terminal methyl groups illustrates the maximum artificial conflict fragmentation uncharacteristic for n-alkanes.
Fragmentation of n-perfluoroalkanes
Compared with sixty spectra of n-alkanes presented in the NIST libraries, the number of n-perfluoroalkanes spectra is only ten, and nine of them were obtained, first described and compared with spectra of n-alkanes in [20–21] and review [22].
Measurements of perfluoroalkanes ionization potentials showed that with increase in molecular mass (with increase in atoms and bonds number of homologue, the ionization potentials IP1 of C2-C6 decrease from 14.48 to 12.74 eV [23].
Upon fragmentation of perfluoroalkanes, as well as upon fragmentation of n-alkanes, three series of ions are formed, i. e. an alkyl series with most intense ion peaks, an alkenyl series with medium intensity peaks, and an olefinic series with low intensity peaks. In spectra of perfluoroalkanes, unlike n-alkanes, the change of base ion does not occur. The mass of basic ion +[CF3] with m/z 69 is the same for all perfluoroalkane homologs. It is close to maximum mass of base m/z peak of 57 n-alkanes, as well as to mass of most intense alkyl ion +[C5H11] with m/z 71 in spectrum of C60H122.
In contrast to spectra of n-alkanes, in which two alkyl series of ions are formed upon the detachment of methyl and ethyl radicals, the constancy of base ion of perfluoroalkanes is apparently the result of non-alternative way at its formation in a single alkyl series.
The constancy of perfluoroalkanes basic ion allows us to conclude that the fragmentation of perfluoroalkanes occurs without the participation of radicals ·CF3 and ·C2F5. In all mass spectra of n-perfluoroalkanes, the primary decay process is the separation of fluorine atom.
The molecular ions of first two perfluoroalkane homologues C1 and C2 are fragmented by sequential detachment of three fluorine atoms, suggesting the hydrogen fragmentation of first two homologues of n-alkanes. The parent ions of fragmentation series of n-perfluoroalkanes homologues are weak peaks of alkyl ion series: [MF]+ and [M-F + CF2]+, similar to detachment of ·CF3, as well as the weak peaks of alkenyl series: [M-3F]+ (M-57) and [M-3F+:CF2] + (M-107) (see Fig. 4).
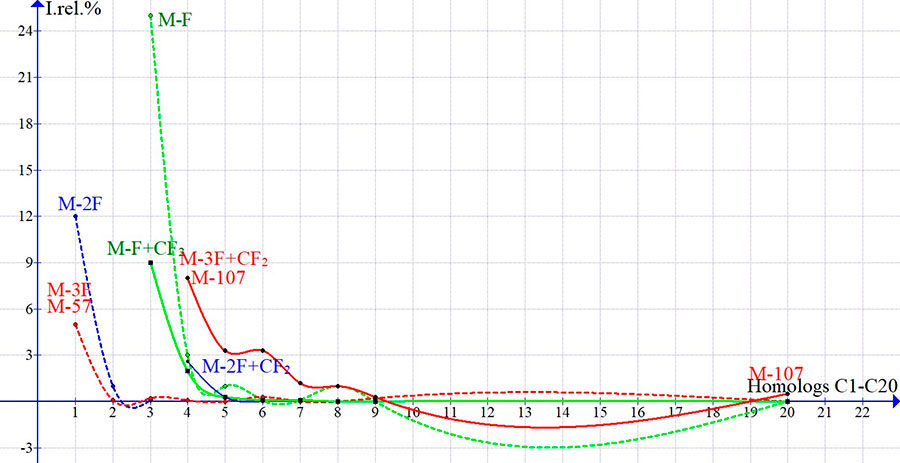
Figure 4. Dependences Irel (in %) of primary ions homologues peaks of n-perfluoroalkanes on its molecular weight.
In spectra of C3-C8, as well as in C20, the sequence of detachments (M-57) and (M-107) confirms the participation of CF2 in fragmentation of perfluoroalkanes. After detachment of one fluorine atoms in CF3 group, the second detachment of fluorine atoms should lead to form the olefin ion or ion from terminal vinyl group. The third detachment of fluorine atom, possibly - from second terminal group CF3, opens a methylene chain fragmenting of CF2 by successive detachments to form a series of alkenyl ions. The weak primary peaks of olefin ions fragmentation of perfluoroalkanes [M-2F+ CF2] with m/z 150 and 200 are visible in spectra C4 and C5. In C20 spectrum, the intensities of olefin peaks in series with m/z 350, 300, 250 and 200 are 0.1% and only for ions +[C3F6] and +[C2F4] the intensities of peaks with m/z 150 and 100 increase to 0.5 % and 7.1%, respectively.
The molecular radical cation +·[CF4] is fragmented by three successive detachments of fluorine atom with formation of ions +[CF3] 100%, +·[CF2] 12% and +·[CF] 5%. The decay of +·[C2F6] occurs by successive detachments of 3 fluorine atoms with formation of ions: +[C2F5] 41%, +·[C2F4] 1% and +[C23] 0.1%. The base ion +[CF3] in C2 mass spectrum is formed not in M/2 process with an ion to radical mass ratio of 1: 1, but as a result of decay of +[C2F5] ion into +[CF3] and CF2 with a mass ratio of 1.38: 1. The ion +[CF3] is fragmented by successive emissions of fluorine atom to form +[CF2] ions 10% and +[CF] ions 18%.
Fragmentation of C20F42
First recorded alkenyl fragmentation ion of homologue C20 (mass spectrum mainlib NIST, Contributer: Japan AIST/NIMS Database-Spectrum MS-IW-46) is ion +[C19F39], 0.5% with m/z 931 (M-107), formed upon detachment of +·[M] - 3F + CF2. In C20 spectrum, as a result of fragmentation of C19F39 ion, a series of increasing in intensity of alkenyl ions is formed, which differ by CF2 group, with m/z 731- 0,1%, m/z 681 - 0,2%, m/z 631 - 0,2%, m/z 581 - 0,3%, m/z 531 - 0,5%, m/z 481 - 0,9%, m/z 431 - 1,4%, m/z 381 - 2,6%, m/z 331 - 4,6%, m/z 281 - 8,5%, m/z 231 - 13,9%, m/z 181 - 17,3%, and most intense ion +[C3F5] with m/z 131 - 41%.
Second recorded fragment ion in C20 spectrum is M-269 ion +[С15F31] with m/z 769 - 0.1%, which is formed upon detachment of fluorine atom and five emissions of difluoromethylene. The ion with m/z 769 - 0.1% is the parent ion for series of alkyl ions increasing in intensity: m/z 719 - 0.2%, m/z 669 - 0.3%, m/z 619 - 0.4%, m/z 569 - 0.6%, m/z 519 (M/2) - 0, 9%, m/z 469 - 1.5%, m/z 419 - 3.3%, m/z 369 - 7.2%, m/z 319 - 15.6%, m/z 269 - 28.5%, m/z 219 - 48.4, m/z 169 - 57.4%, m/z 119 - 35.5% and base ion +[CF3]. In C20 spectrum, the intensity of perfluoroalkyl ion peak +[C2F5] nearest to base peak decreases to 36%, while in C8 spectrum it was 57%. Decrease in intensity of ion peak with m/z 119 (see Fig. 1) is apparently the result of its parallel fragmentation into olefin ion by detachment of fluorine atom +[C2F4]: +[C2F5] +- F +[C2F4] - 7%. The primary processes of alkyl and alkenyl fragmentation of perfluoroalkanes differ in two additional detachments of fluorine atom occurring during alkenyl fragmentation.
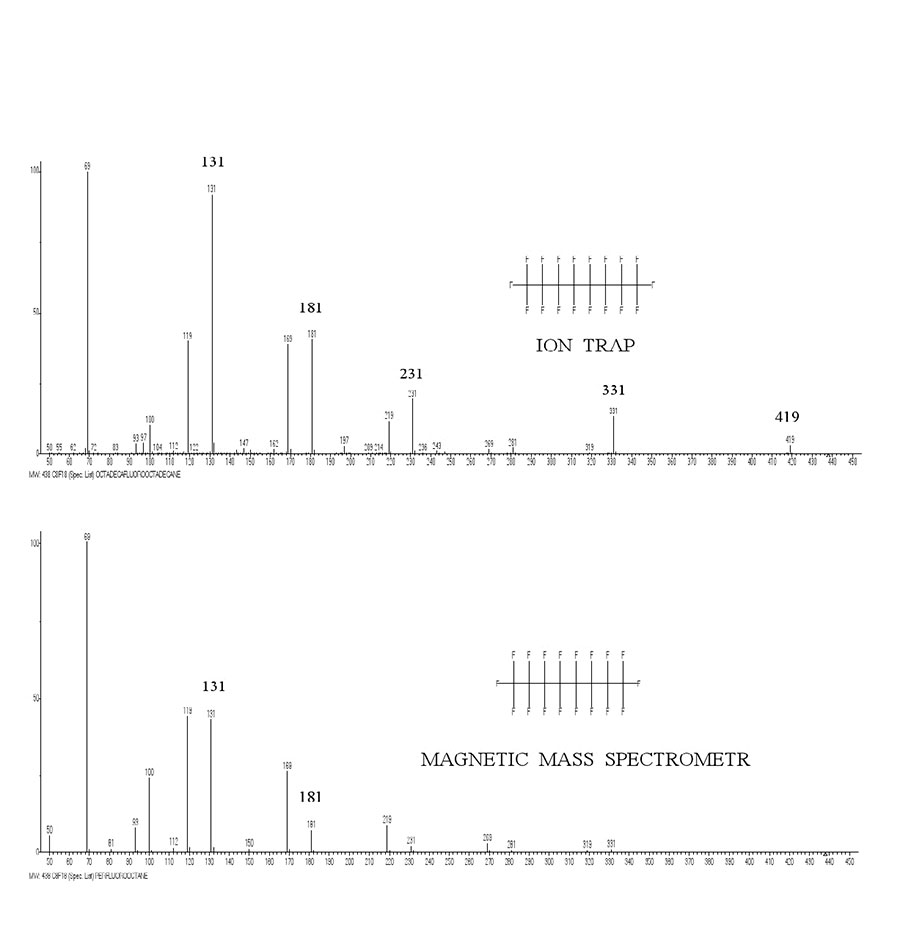
Figure 5. Spectra of n-perfluorooctane recorded by magnetic mass spectrometer and by ion trap mass spectrometer.
The mass spectrum for perfluorooctane recorded via ion trap spectrometer (Polaris Q) is very different from spectrum recorded via magnetic mass spectrometer (see Fig. 5). In the ion trap, alkenyl fragmentation becomes the predominant.
Apparently, the increase in residence time of ions in zone of its separation leads to increase in probability of alkenyl fragmentation compared to alkyl fragmentation. In this case, the base ion +CF3 becomes a partially rearrangement ion.
Acknowledgments
This work was supported by Ministry of Science and Higher Education of Russian Federation using scientific equipment of Molecules Structure Study Center of INEOS RAS.
Literature
- Hood A., in Mass Spectrometry of Organic Ions, edited by McLafferty F.W., Academic Press Inc., New York, 1963, p. 597.
- Meyerson S., Nevitt T.D., and Rylander P.N., Advan. Mass Spectrometry Proc. Conf. Univ. London, 1958, 1, 313.
- Meyerson S., J.Chem. Phys., 1965, 42, 2181.
- Schug J.C., J.Chem. Phys., 1963, 38, 2610.
- Rosenstock H.M. Ph.D. thesis, University of Utah, Salt Lake City, 1952.
- Wallenstein M.B., Wahrhafting A.L., Rosenstock H.M. and Eyring, H. , in Symposium on Radiobioloy, edited by Nickson, J.J., John Wiley & Sons, Inc., New York, 1952, p.70.
- Rosenstock H.M., Wahrhafting A.L. and Eyring, H. J., Chem. Phys., 1955, 23, 2200.
- Beynon J.H., Saunders, R.A., Topham, A. and Williams, A.E. J. Phys.Chem., 1961, 65, 114.
- Gur'ev M.V. and Tikhomirov,M., Zh. Fiz. Khim., 1958, 32, 2731. (in Russian)
- Gur'ev M.V., Tikhomirov,M., and Tunitskii', Zh. Fiz. Khim., 1958, 32, 2847. (in Russian)
- Gur'ev M.V., Doklady Akad. Nauk SSSR, 1961, 136, 856. (in Russian)
- Turkevich J., and Steiner,B.W.,Second Annual Meeting of ASTM Committee E-14 on Mass Spectrometry, New Orleans, Louisiana, May, 1954.
- Schug J.C., J.Chem. Phus. 38, 2610 (1963).
- Polyakova A.A., Khmelnitsky R.Kh., Mass spectrometry in organic chemistry, Publishing House «Chemistry», Leningrad Branch, 1972, 47, 146 р. (in Russian)
- Takhistov V.V. Organic mass spectrometry. Thermochemical description of the isomerization and fragmentation of ions and radicals in the gas phase., Leningrad, «Science», 1990, 24-25, 221 р. (in Russian)
- Patrick C.R., The Thermochemistry of organic fluorine compounds p1-34. in Storey M., Tatlow J.C. and Sharp A.G. (Eds),"Advances in Fluorine Chemistry", Vol.2, London Butterwords 1961.
- Kagramanov N.D. and Tyutyunov A.A. Fluorine notes, 2019, 5(126).
- Steiner B., Giese C.F., Inghhram M.G., J. Chem. Phys., 1961, 34, 189.
- Ficalora P.J., Thompson J.C., Margrave J.L., J. Inorg. and Nucl. Chem., 1969, 31, 3771.
- Mohler F.L., Dibeler, V.H. and Reese, R.M., J.Res. Nat. Bur.Stand., 1952, 49, 343.
- Mohler F.L., Dibeler, V.H. and Reese, R.M., J.Res. Nat. Bur.Stand., 1955, 54, 127.
- Majer J.R., “Mass spectrometry of fluorine compounds” in Storey M., Tatlow J.C. and Sharp A.G. (Eds), “Advances in Fluorine Chemistry”, Vol.2, Butterworth, Washington, 1961, 55-103 and the refereces therein.
- Robin M. B., Higher Excited States of Polyatomic Molecules, N.Y.: Acad. Press, 1974, 1, 256p.
ARTICLE INFO
Received 28 January 2019
Accepted 14 February 2020
Available online February 2020
Recommended for publication by Prof. S. Igumnov
Fluorine Notes, 2020, 128, 3-4